Analysis of Legally Operating Businesses in NYC, plus GeoPandas!
In this post, I will demonstrate how to perform some simple analyses on the Legally Operating Businesses in NYC dataset. I’ll be reading in the dataset from the json format, so it will require some manipulation to read and pull the data we want.
I’ll also be showing how to use the GeoPandas library to read a geospatial map of NYC and plot the businesses by latitude and longitude coordinates over the map. Let’s get right into it!
First, load the necessary libraries:
import numpy as np
import pandas as pd
import json
import ijson
import matplotlib.pyplot as plt
import seaborn as sns
%%bash
head LegallyOperatingBusinessesNYC.json
{
  "meta" : {
    "view" : {
      "id" : "w7w3-xahh",
      "name" : "Legally Operating Businesses",
      "attribution" : "Department of Consumer Affairs (DCA)",
      "averageRating" : 0,
      "category" : "Business",
      "createdAt" : 1425675688,
      "description" : "This data set features businesses/individuals holding a DCA license so that they may legally operate in New York City. Note: Sightseeing guides and temporary street fair vendors are not included in this data set.",
# Read json file
with open('LegallyOperatingBusinessesNYC.json', 'r') as myfile:
    data=myfile.read()

# Parse file and load into dictionary
obj = json.loads(data)
# View json keys
obj.keys()
dict_keys(['meta', 'data'])
This shows us that meta and data are top level keys in the LegallyOperatingBusinessessNYC.json data
# Iteratively read and parse json file while specifiying path meta.view.columns
filename = "LegallyOperatingBusinessesNYC.json"
with open(filename, 'r') as f:
    objects = ijson.items(f, 'meta.view.columns.item')
    columns = list(objects)
# View first item in columns list
print(columns[0])
{'id': -1, 'name': 'sid', 'dataTypeName': 'meta_data', 'fieldName': ':sid', 'position': 0, 'renderTypeName': 'meta_data', 'format': {}, 'flags': ['hidden']}
Each item in columns is a dictionary that contains information about each column. In order to get our header, it looks like fieldName is the relevant key to extract. To get our column names, we just have to extract the fieldName key from each item in columns:
column_names = [col["fieldName"] for col in columns]
# View column_names
column_names
[':sid',
 ':id',
 ':position',
 ':created_at',
 ':created_meta',
 ':updated_at',
 ':updated_meta',
 ':meta',
 'license_nbr',
 'license_type',
 'lic_expir_dd',
 'license_status',
 'license_creation_date',
 'industry',
 'business_name',
 'business_name_2',
 'address_building',
 'address_street_name',
 'address_street_name_2',
 'address_city',
 'address_state',
 'address_zip',
 'contact_phone',
 'address_borough',
 'detail',
 'community_board',
 'council_district',
 'bin',
 'bbl',
 'nta',
 'census_tract',
 'detail_2',
 'longitude',
 'latitude',
 'location',
 ':@computed_region_efsh_h5xi',
 ':@computed_region_f5dn_yrer',
 ':@computed_region_yeji_bk3q',
 ':@computed_region_92fq_4b7q',
 ':@computed_region_sbqj_enih']
Extract the data by making a list of desired useful columns. NOTE: ‘location’ column was excluded because latitude and longitude were used only for later analysis
good_columns = [
    'license_nbr',
    'license_type',
    'lic_expir_dd',
    'license_status',
    'license_creation_date',
    'industry',
    'business_name',
    'business_name_2',
    'address_building',
    'address_street_name',
    'address_street_name_2',
    'address_city',
    'address_state',
    'address_zip',
    'contact_phone',
    'address_borough',
    'detail',
    'community_board',
    'council_district',
    'bin',
    'bbl',
    'nta',
    'census_tract',
    'detail_2',
    'longitude',
    'latitude']
# Extract desired data
data = []
with open(filename, 'r') as f:
    objects = ijson.items(f, 'data.item')
    for row in objects:
        selected_row = []
        for item in good_columns:
            selected_row.append(row[column_names.index(item)])
            data.append(selected_row)
# View first item in data
data[0]
['2080385-DCA',
 'Individual',
 '2020-10-31T00:00:00',
 'Active',
 '2018-12-03T00:00:00',
 'Tow Truck Driver',
 'DELACRUZ VARGAS, CARLOS',
 None,
 None,
 None,
 None,
 'NEW YORK',
 'NY',
 '10027',
 '9173731141',
 None,
 None,
 None,
 None,
 None,
 None,
 None,
 None,
 None,
 None,
 None]
# Create pandas df to analyze data
businesses = pd.DataFrame(data, columns=good_columns)
# View businesses dataframe
businesses.head()
| license_nbr | license_type | lic_expir_dd | license_status | license_creation_date | industry | business_name | business_name_2 | address_building | address_street_name | ... | detail | community_board | council_district | bin | bbl | nta | census_tract | detail_2 | longitude | latitude | |
|---|---|---|---|---|---|---|---|---|---|---|---|---|---|---|---|---|---|---|---|---|---|
| 0 | 2080385-DCA | Individual | 2020-10-31T00:00:00 | Active | 2018-12-03T00:00:00 | Tow Truck Driver | DELACRUZ VARGAS, CARLOS | None | None | None | ... | None | None | None | None | None | None | None | None | None | None |
| 1 | 2080385-DCA | Individual | 2020-10-31T00:00:00 | Active | 2018-12-03T00:00:00 | Tow Truck Driver | DELACRUZ VARGAS, CARLOS | None | None | None | ... | None | None | None | None | None | None | None | None | None | None |
| 2 | 2080385-DCA | Individual | 2020-10-31T00:00:00 | Active | 2018-12-03T00:00:00 | Tow Truck Driver | DELACRUZ VARGAS, CARLOS | None | None | None | ... | None | None | None | None | None | None | None | None | None | None |
| 3 | 2080385-DCA | Individual | 2020-10-31T00:00:00 | Active | 2018-12-03T00:00:00 | Tow Truck Driver | DELACRUZ VARGAS, CARLOS | None | None | None | ... | None | None | None | None | None | None | None | None | None | None |
| 4 | 2080385-DCA | Individual | 2020-10-31T00:00:00 | Active | 2018-12-03T00:00:00 | Tow Truck Driver | DELACRUZ VARGAS, CARLOS | None | None | None | ... | None | None | None | None | None | None | None | None | None | None |
5 rows × 26 columns
businesses.tail()
| license_nbr | license_type | lic_expir_dd | license_status | license_creation_date | industry | business_name | business_name_2 | address_building | address_street_name | ... | detail | community_board | council_district | bin | bbl | nta | census_tract | detail_2 | longitude | latitude | |
|---|---|---|---|---|---|---|---|---|---|---|---|---|---|---|---|---|---|---|---|---|---|
| 5182445 | 1054840-DCA | Business | 2020-12-31T00:00:00 | Active | 2000-12-05T00:00:00 | Tobacco Retail Dealer | K P DELI CORP. | None | 255 | HYLAN BLVD | ... | 5 | 501 | 49 | 5090837 | 5028530001 | SI37 | 8 | None | -74.07037351766044 | 40.61193872381227 |
| 5182446 | 1054840-DCA | Business | 2020-12-31T00:00:00 | Active | 2000-12-05T00:00:00 | Tobacco Retail Dealer | K P DELI CORP. | None | 255 | HYLAN BLVD | ... | 5 | 501 | 49 | 5090837 | 5028530001 | SI37 | 8 | None | -74.07037351766044 | 40.61193872381227 |
| 5182447 | 1054840-DCA | Business | 2020-12-31T00:00:00 | Active | 2000-12-05T00:00:00 | Tobacco Retail Dealer | K P DELI CORP. | None | 255 | HYLAN BLVD | ... | 5 | 501 | 49 | 5090837 | 5028530001 | SI37 | 8 | None | -74.07037351766044 | 40.61193872381227 |
| 5182448 | 1054840-DCA | Business | 2020-12-31T00:00:00 | Active | 2000-12-05T00:00:00 | Tobacco Retail Dealer | K P DELI CORP. | None | 255 | HYLAN BLVD | ... | 5 | 501 | 49 | 5090837 | 5028530001 | SI37 | 8 | None | -74.07037351766044 | 40.61193872381227 |
| 5182449 | 1054840-DCA | Business | 2020-12-31T00:00:00 | Active | 2000-12-05T00:00:00 | Tobacco Retail Dealer | K P DELI CORP. | None | 255 | HYLAN BLVD | ... | 5 | 501 | 49 | 5090837 | 5028530001 | SI37 | 8 | None | -74.07037351766044 | 40.61193872381227 |
5 rows × 26 columns
# View basic summary statistical details of data
businesses.describe()
| license_nbr | license_type | lic_expir_dd | license_status | license_creation_date | industry | business_name | business_name_2 | address_building | address_street_name | ... | detail | community_board | council_district | bin | bbl | nta | census_tract | detail_2 | longitude | latitude | |
|---|---|---|---|---|---|---|---|---|---|---|---|---|---|---|---|---|---|---|---|---|---|
| count | 5182450 | 5182450 | 5181566 | 5182450 | 5182450 | 5182450 | 5181124 | 847626 | 3299790 | 3319212 | ... | 3012100 | 2932982 | 2941432 | 2895776 | 2895802 | 2930668 | 2930668 | 730002 | 3110926 | 3110926 |
| unique | 199323 | 2 | 1497 | 2 | 6845 | 59 | 156282 | 24583 | 13099 | 10970 | ... | 5 | 69 | 60 | 48315 | 48594 | 193 | 1308 | 6446 | 58954 | 58954 |
| top | 1374839-DCA | Business | 2021-02-28T00:00:00 | Inactive | 2018-02-23T00:00:00 | Home Improvement Salesperson | T-MOBILE NORTHEAST LLC | T-MOBILE | 1 | BROADWAY | ... | 3 | 105 | 3 | 0 | 4000000000 | MN17 | 96 | General Vendor Type: General Vendor (White) | -77.51958437167269 | 40.11238533659802 |
| freq | 52 | 3319212 | 755924 | 3214406 | 7618 | 846092 | 15834 | 7254 | 12376 | 96434 | ... | 878228 | 127062 | 84266 | 43550 | 19526 | 92612 | 27586 | 116480 | 168428 | 168428 |
4 rows × 26 columns
From the details, it can be seen that there are 5182450 rows. There are 2 license types, with license type “Business” being the most common, with a frequency of 3319212. The most common industry is “Home Improvement Salesperson”, with a frequency of 846092. The most common business_name is “T-MOBILE NORTHEAST LLC”, with a frequency of 15834. THe most common address street name is “BROADWAY”, with a frequency of 96434.
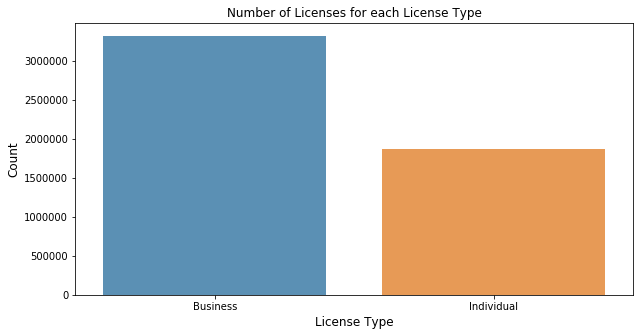
How many businesses are there sorted by license_type?
businesses["license_type"].value_counts()
Business      3319212
Individual    1863238
Name: license_type, dtype: int64
n, m = businesses.shape
print("Rows:", n)
print("Columns:", m)
Rows: 5182450
Columns: 26
# Plot a bar graph of the number of licenses for each license_type
license_count = businesses['license_type'].value_counts()
plt.figure(figsize=(10,5))
sns.barplot(license_count.index, license_count.values, alpha=0.8)
plt.title('Number of Licenses for each License Type')
plt.ylabel('Count', fontsize=12)
plt.xlabel('License Type', fontsize=12)
plt.show()
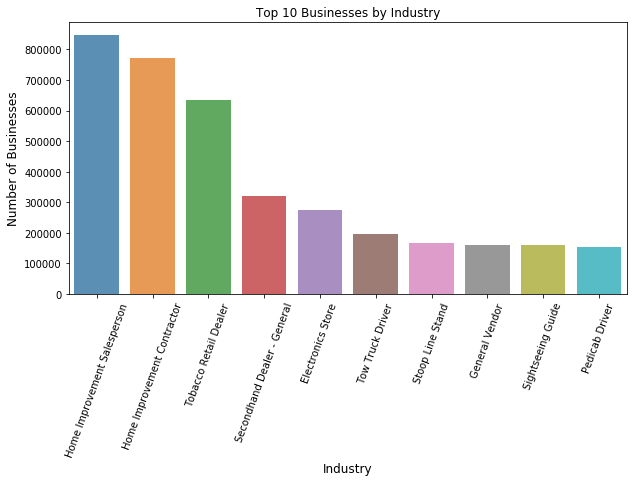
What are the top industries?
businesses["industry"].value_counts()
Home Improvement Salesperson      846092
Home Improvement Contractor       771394
Tobacco Retail Dealer             633074
Secondhand Dealer - General       321776
Electronics Store                 273312
Tow Truck Driver                  197756
Stoop Line Stand                  167674
General Vendor                    161408
Sightseeing Guide                 160368
Pedicab Driver                    155194
Electronic & Appliance Service    135356
Laundries                         114842
Laundry                           112060
Locksmith                         105014
Debt Collection Agency            103610
Process Server Individual         101556
Ticket Seller                      86034
Electronic Cigarette Dealer        80730
Sidewalk Cafe                      79924
Laundry Jobber                     79378
Garage                             64974
Dealer In Products                 49218
Secondhand Dealer - Auto           43680
Amusement Device Portable          39650
Tow Truck Company                  30732
Parking Lot                        28106
Employment Agency                  24492
Pawnbroker                         24440
Amusement Device Temporary         20332
Auctioneer                         19526
Motion Picture Projectionist       16952
Pedicab Business                   16562
Newsstand                          13754
Special Sale                       13078
Horse Drawn Driver                 11960
Process Serving Agency              8970
Cabaret                             8658
Amusement Device Permanent          7436
Garage and Parking Lot              6240
Games of Chance                     6058
Car Wash                            4316
Gaming Cafe                         3822
Scrap Metal Processor               3666
Pool or Billiard Room               3588
Horse Drawn Cab Owner               3562
Catering Establishment              3224
Bingo Game Operator                 3120
Tow Truck Exemption                 3042
Storage Warehouse                   2704
Auction House Premises              2548
Scale Dealer Repairer               1794
Amusement Arcade                    1378
Locksmith Apprentice                1378
Sightseeing Bus                     1352
General Vendor Distributor           442
Commercial Lessor                    364
Secondhand Dealer - Firearms         312
Booting Company                      312
Ticket Seller Business               156
Name: industry, dtype: int64
# Plot a bar graph of the top 10 industries
industry_count = businesses['industry'].value_counts()
industry_count = industry_count[:10,]
plt.figure(figsize=(10,5))
chart = sns.barplot(industry_count.index, industry_count.values, alpha=0.8)
plt.title('Top 10 Businesses by Industry')
plt.ylabel('Number of Businesses', fontsize=12)
plt.xlabel('Industry', fontsize=12)
chart.set_xticklabels(chart.get_xticklabels(), rotation=70)
plt.show()
How many licenses are active vs. inactive?
businesses["license_status"].value_counts()
Inactive    3214406
Active      1968044
Name: license_status, dtype: int64
# Plot a bar graph of Inactive vs. Active Licenses
status_count = businesses['license_status'].value_counts()
plt.figure(figsize=(10,5))
sns.barplot(status_count.index, status_count.values, alpha=0.8)
plt.title('Number of Inactive vs. Active Licenses')
plt.ylabel('Count', fontsize=12)
plt.xlabel('License Status', fontsize=12)
plt.show()

# Create subset df of individual active licenses where latitude and longitude is given
df = businesses[(businesses['license_type'] == 'Individual') & (businesses['license_status'] == 'Active') & (businesses['latitude'].notnull()) & (businesses['longitude'].notnull())]
df
| license_nbr | license_type | lic_expir_dd | license_status | license_creation_date | industry | business_name | business_name_2 | address_building | address_street_name | ... | detail | community_board | council_district | bin | bbl | nta | census_tract | detail_2 | longitude | latitude |
|---|
0 rows × 26 columns
Interestingly, all individual active licenses do not have latitude and longitude coordinates listed!
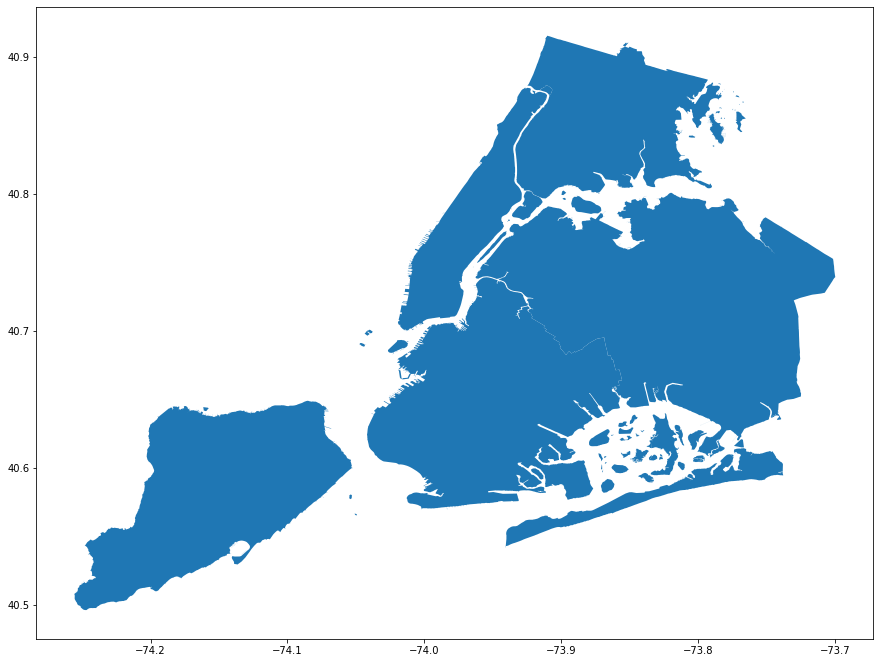
Geospatial Analysis
To load the map, we need to download the shapefile from Borough Boundaries NYC Open Data. I renamed the shapefile to NYC_geospatial.shp for simplification.
# Plot map
import descartes
import geopandas as gpd
from shapely.geometry import Point, Polygon
# Read geospatial map file
street_map = gpd.read_file('NYC_geospatial.shp')
fix, ax = plt.subplots(figsize = (15, 15))
street_map.plot(ax=ax)
<matplotlib.axes._subplots.AxesSubplot at 0x1bbb11a610>
# Create subset df of active businesses where latitude and longitude is given
df = businesses[(businesses['license_status'] == 'Active') & (businesses['latitude'].notnull()) & (businesses['longitude'].notnull())]
# Keep only industry, latitude and longitude coordinates of df
df = df[['industry', 'latitude', 'longitude']]
# Inspect df
df
| industry | latitude | longitude | |
|---|---|---|---|
| 12090 | Stoop Line Stand | 40.718663472948315 | -73.99761907513695 |
| 12091 | Stoop Line Stand | 40.718663472948315 | -73.99761907513695 |
| 12092 | Stoop Line Stand | 40.718663472948315 | -73.99761907513695 |
| 12093 | Stoop Line Stand | 40.718663472948315 | -73.99761907513695 |
| 12094 | Stoop Line Stand | 40.718663472948315 | -73.99761907513695 |
| ... | ... | ... | ... |
| 5182445 | Tobacco Retail Dealer | 40.61193872381227 | -74.07037351766044 |
| 5182446 | Tobacco Retail Dealer | 40.61193872381227 | -74.07037351766044 |
| 5182447 | Tobacco Retail Dealer | 40.61193872381227 | -74.07037351766044 |
| 5182448 | Tobacco Retail Dealer | 40.61193872381227 | -74.07037351766044 |
| 5182449 | Tobacco Retail Dealer | 40.61193872381227 | -74.07037351766044 |
1073644 rows × 3 columns
# Convert latitude and longitude to float
df['latitude'] = df['latitude'].astype(float)
df['longitude'] = df['longitude'].astype(float)
df.describe()
| latitude | longitude | |
|---|---|---|
| count | 1.073644e+06 | 1.073644e+06 |
| mean | 4.071494e+01 | -7.396611e+01 |
| std | 9.905580e-02 | 3.541175e-01 |
| min | 4.011239e+01 | -7.751958e+01 |
| 25% | 4.066054e+01 | -7.398479e+01 |
| 50% | 4.072179e+01 | -7.394054e+01 |
| 75% | 4.076629e+01 | -7.387909e+01 |
| max | 4.091206e+01 | -7.370155e+01 |
# Since some businesses are out of map range, filter to only include businesses within range of map
df = df[(df['latitude'] > 40.45) & (df['latitude'] < 40.95) & (df['longitude'] > -74.3) & (df['longitude'] < -73.6)]
# Convert latitude and longitude coordinates to geometry points
geometry = [Point(xy) for xy in zip(df["longitude"], df["latitude"])]
# Inspect geometry
geometry[:3]
[<shapely.geometry.point.Point at 0x1ba7961a90>,
 <shapely.geometry.point.Point at 0x1ba7961510>,
 <shapely.geometry.point.Point at 0x1ba7961c50>]
# Specify coordinate system
crs = {'init': 'EPSG:4326'}
# Create GeoDataFrame
geo_df = gpd.GeoDataFrame(df, crs = crs, geometry = geometry)
/Users/tonysong/opt/anaconda3/lib/python3.7/site-packages/pyproj/crs.py:77: FutureWarning: '+init=<authority>:<code>' syntax is deprecated. '<authority>:<code>' is the preferred initialization method.
  return _prepare_from_string(" ".join(pjargs))
# Inspect geo_df
geo_df.head()
| industry | latitude | longitude | geometry | |
|---|---|---|---|---|
| 12090 | Stoop Line Stand | 40.718663 | -73.997619 | POINT (-73.99762 40.71866) |
| 12091 | Stoop Line Stand | 40.718663 | -73.997619 | POINT (-73.99762 40.71866) |
| 12092 | Stoop Line Stand | 40.718663 | -73.997619 | POINT (-73.99762 40.71866) |
| 12093 | Stoop Line Stand | 40.718663 | -73.997619 | POINT (-73.99762 40.71866) |
| 12094 | Stoop Line Stand | 40.718663 | -73.997619 | POINT (-73.99762 40.71866) |
What are the top industries with active licenses within the map boundaries?
df["industry"].value_counts()
Home Improvement Contractor       259038
Tobacco Retail Dealer             168636
Secondhand Dealer - General       102700
Laundries                         102440
Electronics Store                  77350
Electronic Cigarette Dealer        74776
Stoop Line Stand                   54704
Electronic & Appliance Service     43784
Sidewalk Cafe                      32968
Garage                             30212
Dealer In Products                 18330
Secondhand Dealer - Auto           14716
Tow Truck Company                  12142
Newsstand                           8944
Employment Agency                   8190
Parking Lot                         8008
Pawnbroker                          7826
Amusement Device Portable           7280
Pedicab Business                    4810
Car Wash                            4082
Debt Collection Agency              3380
Amusement Device Permanent          3146
Garage and Parking Lot              2886
Horse Drawn Cab Owner               1716
Scrap Metal Processor               1664
Process Serving Agency              1560
Storage Warehouse                   1274
Pool or Billiard Room               1092
Games of Chance                     1014
Auction House Premises               910
Bingo Game Operator                  832
Gaming Cafe                          806
Tow Truck Exemption                  546
Scale Dealer Repairer                546
Amusement Arcade                     494
Sightseeing Bus                      286
Commercial Lessor                    156
Booting Company                      130
Amusement Device Temporary           130
Special Sale                         104
General Vendor Distributor            52
Ticket Seller Business                52
Name: industry, dtype: int64
Plot top 3 industries with active licenses over map:
fig, ax = plt.subplots(figsize = (15, 15))
street_map.plot(ax = ax, alpha = 0.4, color = "grey")
geo_df[geo_df['industry'] == 'Home Improvement Contractor'].plot(ax = ax, markersize = 10, color = "blue", marker = "o", label = "Home Improvement Contractor")
geo_df[geo_df['industry'] == 'Tobacco Retail Dealer'].plot(ax = ax, markersize = 10, color = "red", marker = "^", label = "Tobacco Retail Dealer")
geo_df[geo_df['industry'] == 'Secondhand Dealer - General'].plot(ax = ax, markersize = 10, color = "yellow", marker = ".", label = "Secondhand Dealer - General")
plt.title("Top 3 Industries with Active Licenses")
plt.legend(prop = {'size': 15})
<matplotlib.legend.Legend at 0x1b8b84a950>
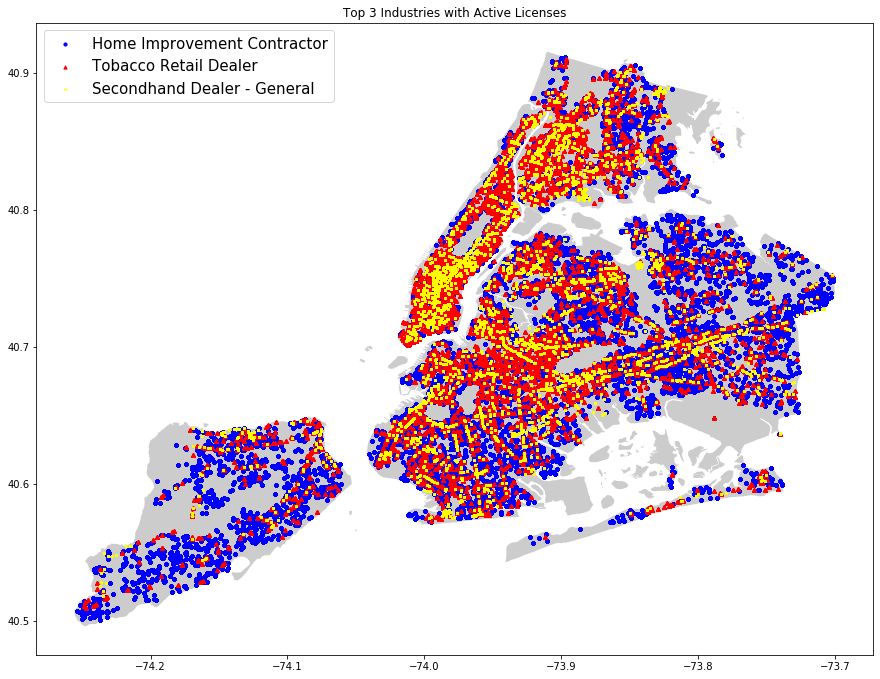
From the map, it can be observed that out of all businesses with active licenses, there are a lot more Home Improvement Contractor businesses in Staten Island compared to Tobacco Retail Dealers and Secondhand Dealers. Also, there is a lot more concentration of Tobacco Retail Dealers and Secondhand Dealers in Manhattan compared to other boroughs.